

Fifteen years after forecasting a 1,000-fold surge in mobile broadband traffic, WiseHarbor founder Keith Mallinson revisits the numbers, arguing his prediction largely captured the economics of the mobile era, despite traffic growth falling short of projections.
Forecasting – particularly out to a very long time horizon – is a mug’s game, and a thankless task. But there’s a need for someone to do it.
In 2011, I published a long-term forecast for mobile broadband data traffic volume and pricing out to 2025. At the time, 4G LTE was only beginning to emerge, feature phones still outnumbered smartphones, tablets had barely arrived and most industry forecasters, as ever, were reluctant to venture beyond a five-year horizon. Yet many of the industry’s most important investments – spectrum licenses, network infrastructure, semiconductor platforms, R&D programs and patent portfolios – have economic lives extending far beyond that.
The purpose of my forecast was not to predict every twist and turn in the market or identify which particular new applications would drive growth. It was to assess the long-run relationship between likely traffic growth, network investment and pricing. Looking back fifteen years later, with Ericsson’s Mobility Report providing historic traffic data figures and reported mobile operator services revenues from the GSMA, it’s possible to revisit those predictions and assess my accuracy – pretty good on both data volumes and pricing.
Demand and economics

The forecast was not solely about traffic growth: it was about network economics.
My key assertion was that mobile broadband would follow a pattern already seen in fixed broadband fiber networks: explosive growth in traffic combined with dramatic declines in the revenue yield per unit of network capacity or data traffic transported. Operators would increasingly rely on huge growth in volumes of data traffic to support relatively modest revenue growth. I was distained in 2000 for forecasting very steep price declines for fiber bandwidth, but discovered a decade later that my expectations were very accurate.
An article I wrote about that in May 2011 also summarized my mobile broadband forecast. “While data traffic grows more than 1,000-fold, operator revenue yield per megabyte will decline dramatically from $100 with SMS, $1 in voice and $0.10 with mobile data in 2010 to $0.001 with data predominating in 2025 (global averages including postpaid and prepaid plans).” A revenue yield of $0.001 per megabyte equals $1.00 per gigabyte.
Such a steep price decline was a radical assertion then. Mobile broadband was still widely perceived as a premium service. Mobile operators charged by the megabyte, hence the units of measurement in my quote. Unlimited plans were controversial. While some were concerned that data traffic would overwhelm networks, as had been observed with 3G in cities including New York and San Francisco in 2010, others worried that users would never consume enough data to justify massive 4G LTE equipment and spectrum investments following lackluster returns on 3G investment, for example, in Europe.
My forecast showed that falling prices would stimulate exponentially rising usage. The economic challenge for operators was to manage a business in which traffic grew much faster than revenues.
Not quite – not yet
My 2011 forecast showed cellular data traffic increasing by a factor of 1,000 between 2010 and 2025.
Normalizing Ericsson’s reported traffic to the same 2010 baseline, actual growth was approximately 564-fold by 2025. The Ericsson Mobility Report estimates total mobile network traffic, including FWA, of 203 EB per month at the end of 2025. Which is directionally right, but numerically high.
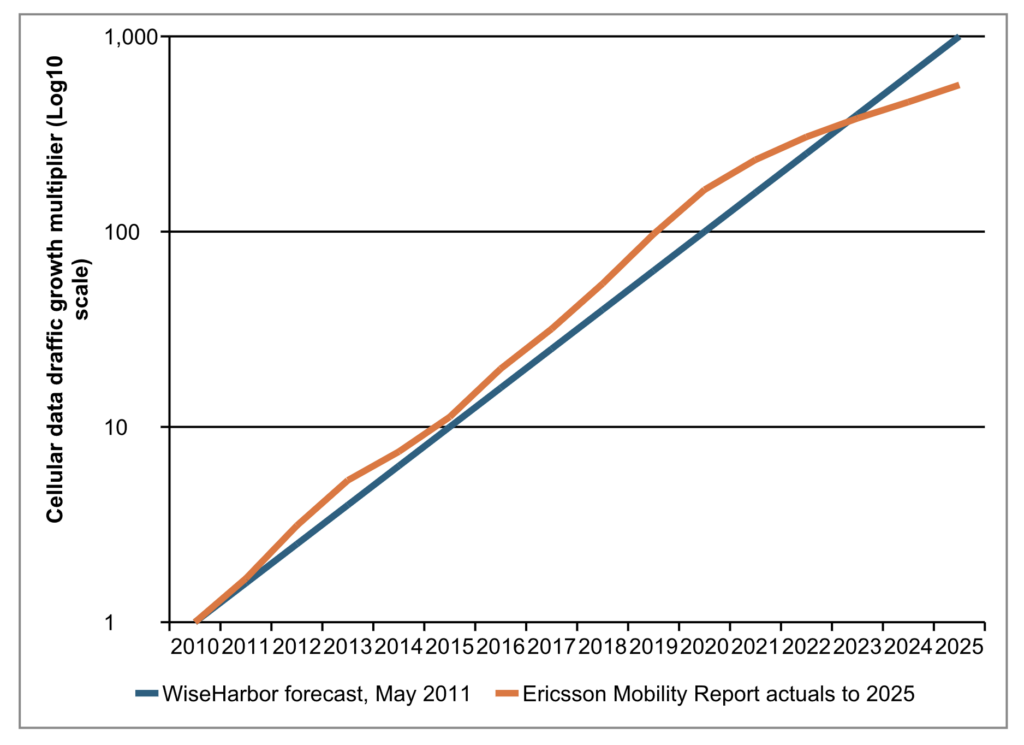
Judged purely by the terminal value, I overshot by about 77%. Seemingly a big miss? Not so much given that actual growth was almost three orders of magnitude.
However, long-run exponential forecasts are more appropriately assessed by growth rates rather than by final-year differences. My forecast implied a compound annual growth rate of 58% between 2010 and 2025. Ericsson’s actuals imply growth of 53% annually over the same period. In other words, I was only around 5% too optimistic on the actual CAGR over a fifteen-year period.
While differences compounded over the years, the trajectories of my forecast and actuals remained surprisingly close for most of the forecast period. Ericsson’s actual traffic figures exceeded my forecast for much of the 2013-2022 period, including by more than 60% in 2020. Only in 2023 did the lines converge, after which actual growth moderated significantly relative to my projection. Growth in absolute terms (i.e. in EB/month) has continued to increase greatly while percentage growth rates on the enormously increased base figure have reduced over the last few years.
The broad conclusion is that the forecast correctly anticipated the orders of magnitude of growth and the persistence of exponential expansion for more than a decade, even though it somewhat overestimated the rate at which that growth would continue into the mid-2020s.
Divergence drivers
Several developments help explain the gap.
First, human attention ultimately becomes a limiting factor. Mobile video, social media and streaming achieved deep subscriber penetration and extraordinary traffic growth, but users still have finite hours in the day. While video quality has improved, enhanced video compression has moderated the increases in bandwidth that demands. Usage has continued to increase in absolute terms, though more slowly percentagewise than the uninterrupted exponential path I projected
Second, fixed broadband remained strong. Ericsson’s tracking shows fixed-network data traffic still substantially exceeding mobile-network data traffic globally. Smartphone connections via Wi-Fi and copper or fiber – particularly at home and in the office or study campus – have continued to absorb large volumes of video consumption even while cellular network usage expanded rapidly.
Third, growth became increasingly concentrated in a handful of very large mobile-first markets, particularly India.
The pricing forecast
The pricing side of my forecast may have aged better than the traffic side. My projected global operator revenue yield of approximately $1.00 per GB by 2025 is remarkably close to my original forecast, given the 100-fold drop and inherent imprecision in measuring prices paid.
GSMA reports approximately $1.19 trillion in mobile operator revenues in 2025. Ericsson reports 203 EB per month of total mobile network traffic including FWA. Dividing one figure by the other results in an implied global weighted average industry revenue yield of $0.49 per GB. That’s around half the figure I forecast for 2025, but price measurements are inherently imprecise.
These results should not be confused with consumer tariff comparisons. A widely quoted global figure of around $2.60 per GB originates from studies that average advertised mobile-data plan prices across countries. Cable.co.uk calculates this figure in 2023 from more than 5,600 plans across 237 countries.
Such measures are interesting but are limited regarding industry economics globally. They appear to be offered prices that are not weighted by national subscriber counts or traffic volumes. Total revenues divided by traffic volume is much more in line with an economist’s concept of the average price that’s actually paid.
The Economist newspaper recently reported that cable.co.uk research, also indicating that mobile data in India cost only around 15 rupees ($0.16) per gigabyte in 2023. Other highly populated nations including Brazil, Nigeria, Vietnam Indonesia and Bangladesh all had costs at or below $0.40. Fierce competition, high population density and extensive reliance on mobile networks produces the world’s lowest prices. India consequently became one of the world’s most intensive consumers of mobile data.
High-priced countries such as Switzerland, the United States and Canada can have disproportionate effect on global averaging if not weighted appropriately. Low-price markets such as India, Indonesia, Bangladesh, Vietnam and Brazil are under-represented in the study’s global average relative to their large populations and the very high traffic volumes per subscriber, also reported in that Economist article.
Report card
If judged solely on traffic, I would award myself a respectable B+. The final traffic level was lower than projected, but the forecast successfully anticipated the scale and persistence of the mobile broadband explosion. If judged on the broader economics, I’m more generous with an A- grading.
The most important conclusion in 2011 was not simply that traffic would increase by roughly 1,000 times by 2025. It was that mobile communications would become a business characterized by vast traffic volumes and exponential declines to orders of magnitude lower revenue yields per unit of data consumed.
Fifteen years later, the “actual” price is uncertain and depends on determination methodology. Given the uncertainties in both data and definitions, my $1.00 per GB prediction is close enough to regard the original forecast as having captured the essential economics of the mobile broadband era. That now includes 5G. This successor to 4G LTE was not even named until after I’d published my forecast in 2011, with initial standardization completed in 2018 and first deployments in 2019.
My data traffic forecast was important. The associated pricing forecast was its key insight.
This echoes my analysis on transatlantic fiber optic volume and pricing trends – also in that May 2011 article – in which I showed my volume and pricing forecasts for that in 2000 (also with high growth and steeply declining prices) were also close to the mark.
What’s next?
The cellular connectivity market is sandwiched between Wifi/ fiber and satellite services – notably Starlink and its wannabe imitators. Cellular FWA is a big traffic generator, but the physics and economics versus those alternatives limit where it is competitive. I’m leaving all the long-term forecasting with division of data traffic supply and demand among alternatives for another day.